
Staging hops
Every transformation between raw and mart is a node, so you see how a value is cleaned, conformed and reshaped along the way.
The Cartographer joins everything the Documenters find into one navigable lineage graph. Follow your data from the source system, through every staging hop, to its place in the final mart, on Microsoft Fabric or Databricks. It is generated as the platform is built, and it is yours to keep.
The Cartographer stitches the lineage that the Documenters captured into a single, navigable graph. It runs through staging hops, slowly changing dimension patterns and surrogate-key joins, so you can trace your data end to end instead of guessing where a number came from.
A sample: every model traced from source system to final mart, the whole estate as one graph.
The lineage carries the patterns that make a migration risky, so the picture is honest about how your data actually moves.
Every transformation between raw and mart is a node, so you see how a value is cleaned, conformed and reshaped along the way.
Slowly changing dimensions and surrogate-key joins are traced explicitly, not lost in the plumbing.
Each legacy table is linked to its new model, so the old estate and the new one read as one connected graph.
Because the graph is queryable, you can see what a change touches before you make it, not after it breaks.
In dbt this lineage comes largely for free; in your own framework we port it in, which is extra effort on our side, and you keep it either way. dbt or your framework →
The lineage is not reverse-engineered after the fact. It is assembled from the same knowledge base the whole migration runs on, so it reflects what your pipelines actually do, then carries forward into the new platform as the builders generate it.
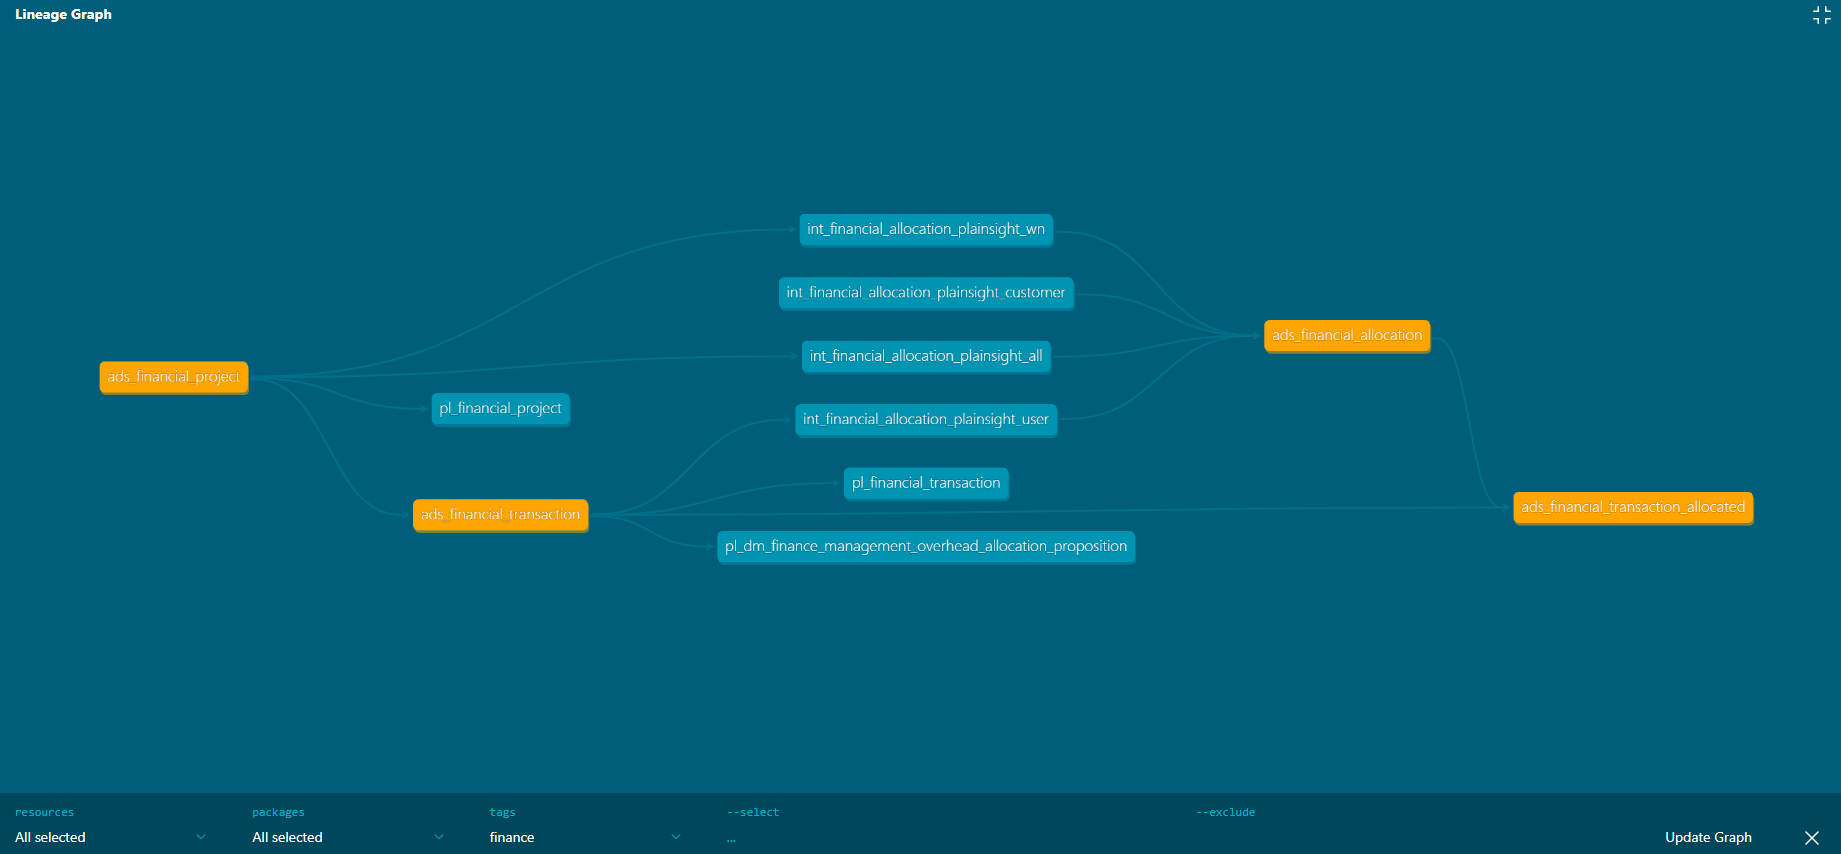
Across the whole estate, from the source system to the final mart. You can follow a table through every staging hop and transformation to where it lands on the new platform, so nothing moves through a black box.
Yes. The lineage is the bridge between the two: every legacy table is mapped to its new home, so an auditor or an engineer can prove where the data came from.
In your platform’s own catalog and your repository. On the dbt flavor it is the dbt docs lineage graph; in your own framework the Cartographer writes the same graph into your catalog.
It is generated metadata, not a screenshot, so it updates with the build and can be queried, filtered and used for impact analysis before you change anything. See everything you keep →
The estate assessment maps the lineage for a representative slice of your estate, so you can see how a field travels from source to target before you commit.
Plan my migrationA short form, no spam. We usually reply within one business day.